Line graphs
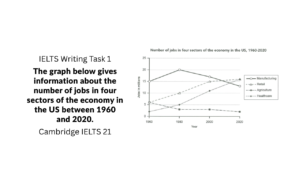
Quick Links: Band 5.5 Sample, Band 6.5 Sample Read the sample answer on the topic: The graph below gives information about the number of jobs

Quick Links: Band 5.5 Sample, Band 6.5 Sample Read the sample answer on the topic: The graph below gives information about the number of jobs