Read the bar graph band 7 sample answer on the topic: The charts below show the main reasons for study among students of different age groups and the amount of support they received from employers.
The charts below show the main reasons for study among students of different age groups and the amount of support they received from employers.
Summarise the information by selecting and reporting the main features, and make comparisons where relevant.

Introduction:
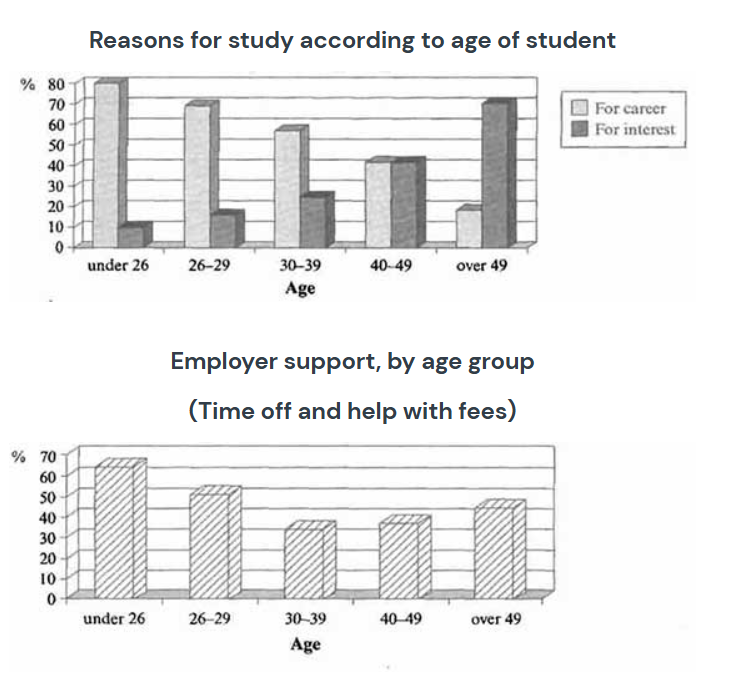
The charts illustrate the reasons why students of different age groups choose to study and the extent of support they receive from their employers.
Overview:
Overall, younger learners were more motivated by career-related reasons and received greater employer support, while older learners tended to study out of personal interest. Employer support was lowest for those aged 30–39, but it slightly improved in the later age groups.
Body Paragraph:
Among students under 26, the vast majority (around 80%) studied primarily for career advancement, and they also enjoyed the highest level of employer support at 60%. Only a small minority of this group, about 10%, pursued education out of personal interest.
As age increased, the proportion of career-oriented learners declined steadily, while the share of those studying for interest grew. The lowest employer support, under 35%, was observed among individuals aged 30–39. By contrast, in the 40–49 age group, an equal proportion of learners studied for career and for interest.
Finally, in the oldest group, aged 50 and above, the majority studied out of personal interest, while career-related study reached its lowest point. Despite this, employer support for this group rose again to around 40%.
Find out more about bar graph band 7 sample answers here.


