Read the bar graph band 7 sample answer on the topic: The chart below shows the percentage of households in owned and rented accommodation in England and Wales between 1918 and 2011.
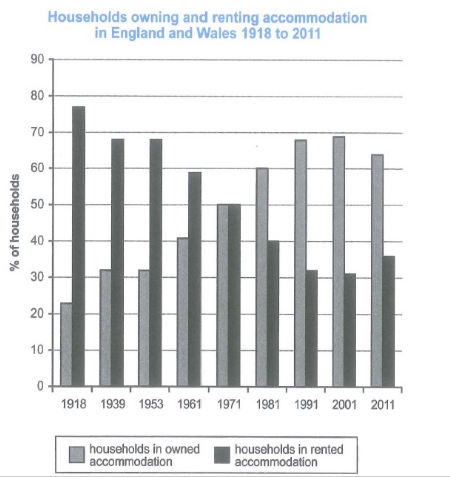
The chart below shows the percentage of households in owned and rented accommodation in England and Wales between 1918 and 2011.
Summarise the information by selecting and reporting the main features, and make comparisons where relevant.
Student Response 1 – Band 5.5:
This chart graph illustrated the percentages of house-owners and tenants in England and Wales from 1918 and 2011.
Overall, This line graph showed that there was gradual increase in households in owned accomodation from 1918 to 2001, with a slight dip in 2011. on the other hand, the households in rented accomodation gradually fell from 1918 and 2001, while a little rose in 2011.
In 1918, the accomodations households in owned accomodation is at 23 percent, whereas the households in rented accomodation was “dramatically high at 77 percent. In 1939 and 1953, owned accomodations were slightly increase to 32 percent, although the rented accomodation were dropped a 1 little bit from 77 to 68 percent. In 1961, the owned rose to 41 percent, in contrast to rented households who dropped to 59 percent. 1971 was the year where both have holds stable at 50 percent From 1981 to 2001, the owned accomodation are gradually rose from 60 percent to 69 percent. However, there was a dramatic decline in rented households from 40 to 31 percent. In 2011, the percentage of own accomodation dropped slightly from 69 to 64 percent & the other shared the slight uptick from 31 to 36 percent.
Why would the student get Band 5.5 in this task?
Grammar is the main issue here. Almost every sentence in this task has a grammatical error that is reducing the score in grammatical range and accuracy.
Student Response 2 – Band 7:
The bar graph illustrates the percentage of house-owners and tenants in England and Wales from 1918 to 2011.
Overall, the line graph showed that there was a gradual increase in households in owned accommodation from 1918 to 2001, with a slight dip in 2011. On the other hand, the households in rented accommodation gradually fell from 1918 to 2001, while they rose slightly in 2011.
In 1918, the households that owned accommodation were at 23 percent, while the households in rented accommodation were dramatically high at 77 percent. In both 1939 and 1953, home ownership increased slightly to 32 percent, whereas the rented accommodation dropped slightly from 77 to 68 percent. In 1961, the house ownership ratio rose to 41 percent; however, the proportion of rented households dropped to 59 percent.
In 1971, the house ownership and renting ratio was the same (50 percent). From 1981 to 2001, owner-occupied accommodation rose gradually from 60 percent to 69 percent. However, there was a dramatic decline in rented households from 40 to 31 percent. In 2011, the percentage of own accommodation dropped slightly from 69 to 64 percent, whereas renting showed a slight growth from 31 to 36 percent.
Student Response 3 – Band 7:
The bar graph illustrates the proportions of families that lived in their own homes and those that were tenants in the two countries of the UK, from 1918 to 2011.
Overall, the trend for owned accommodations increased significantly and rapidly, whereas the households in rented housing experienced a major decline over the years. In other words, there is almost an inverse relation between these categories.
Firstly, there were just around 23% people who resided in their own properties in 1918, and this amount increased by 10% in 1939. From 1939 to 1953, there was no apparent change in the numbers. However, from 1961, the percentages dramatically rose to over 40%. After that, the ratio kept increasing steadily by approximately 10% each time until 2001, when it stabilized for a while before decreasing to nearly 64% in 2011.
In contrast, individuals in rented places were comparably higher at the beginning in 1918, with as many as 78% households. Nevertheless, this number fell to almost 69% in 1939 and remained until 1953. Furthermore, the quantity decreased gradually and reached just over 30% in 2001. Although a slight increment was observed in 2011, with around 37% households paying rent for housing.